How I designed an "intelligent teammate" that automates anomaly detection, explains errors in plain language, and streamlines collaboration for data analysts
Team
2 UX Designers
Date
March 2025 - April 2025
My Role
Product Designer (Lead Design)
UX Researcher
Industries
Business, Accounting
Overview 📝
This was created as part of a 2 week hackathon organized by Iowa State University in collaboration with Workiva.
Workiva is a cloud-based platform for connected reporting and compliance that simplifies complex data management for finance, audit, and risk teams. It serves as a 'single source of truth' for thousands of organizations (including 85% of the Fortune 1000), helping them streamline collaboration and ensure accuracy in their most critical business reports.
The Situation
Datasets are growing in size and complexity, making the manual process of finding spreadsheet errors a significant business bottleneck.
The Result
I designed an AI assistant that acts as an "intelligent teammate" to fix this frustrating and error-prone process. It automatically flags anomalies, explains why they're wrong in plain language, and allows for in-app collaboration, saving users time and improving data accuracy.
Project Management & Version Control 💼
Core AR Implementation 🥽
Gameplay Programming 👨💻
Debugging 🪲
Problem❓
For decades, the process of finding errors in spreadsheets has remained a largely manual and inefficient task. As datasets grow in size and complexity, this has become a significant business bottleneck. Users described the current manual process as "painful" and expressed a need for relief from this time-consuming work.
Project Management & Version Control 💼
Core AR Implementation 🥽
Gameplay Programming 👨💻
Debugging 🪲
😵💫
Lost Productivity
Professionals across industries spend countless hours manually scanning rows and columns to find errors, a pain point confirmed by data analysts, engineers, and accountants.
😵💫
Lost Productivity
Professionals across industries spend countless hours manually scanning rows and columns to find errors, a pain point confirmed by data analysts, engineers, and accountants.
😵💫
Lost Productivity
Professionals across industries spend countless hours manually scanning rows and columns to find errors, a pain point confirmed by data analysts, engineers, and accountants.
🤦♂️
High Risk of Human Error
The manual checking process is tedious and prone to human error, especially when users are fatigued or under pressure. These missed errors can lead to costly mistakes in decision-making.
🤦♂️
High Risk of Human Error
The manual checking process is tedious and prone to human error, especially when users are fatigued or under pressure. These missed errors can lead to costly mistakes in decision-making.
🤦♂️
High Risk of Human Error
The manual checking process is tedious and prone to human error, especially when users are fatigued or under pressure. These missed errors can lead to costly mistakes in decision-making.
⚠️
A Persistent Skill Gap
While experienced users may use advanced functions like pivot tables to find anomalies, these methods are often inaccessible or overwhelming for non-expert users who are encountering a dataset for the first time.
⚠️
A Persistent Skill Gap
While experienced users may use advanced functions like pivot tables to find anomalies, these methods are often inaccessible or overwhelming for non-expert users who are encountering a dataset for the first time.
⚠️
A Persistent Skill Gap
While experienced users may use advanced functions like pivot tables to find anomalies, these methods are often inaccessible or overwhelming for non-expert users who are encountering a dataset for the first time.
Research 🔎
We interviewed 4 data professionals to uncover the psychological barriers to adopting AI. Here is what validated our direction:
The Burden: Manual Cleaning is "Painful"
We hypothesized that manual cleaning was annoying, but users described it as a critical business bottleneck. One user reported spending over 100 hours cleaning a single project.
Key Takeaway: The solution couldn't just be a "helper"; it needed to automate the heavy lifting of detection entirely.
The Trust Gap: Explanation > Identification
Users explicitly stated that simply flagging an error isn't enough. If the AI can't explain why a number is wrong, they won't trust it to fix it.
Key Takeaway: "Explain it, don't just flag it." Trust is tied to transparency, not just accuracy.
The Workflow: Context Switching Kills Focus
Users were frustrated by fragmented workflows where they had to switch between spreadsheets, email, and chat apps to resolve a single error.
Key Takeaway: To be effective, collaboration (tagging/commenting) needed to happen inside the tool, not in a separate window.
These are some quotes that stood out to us.
User Quotes
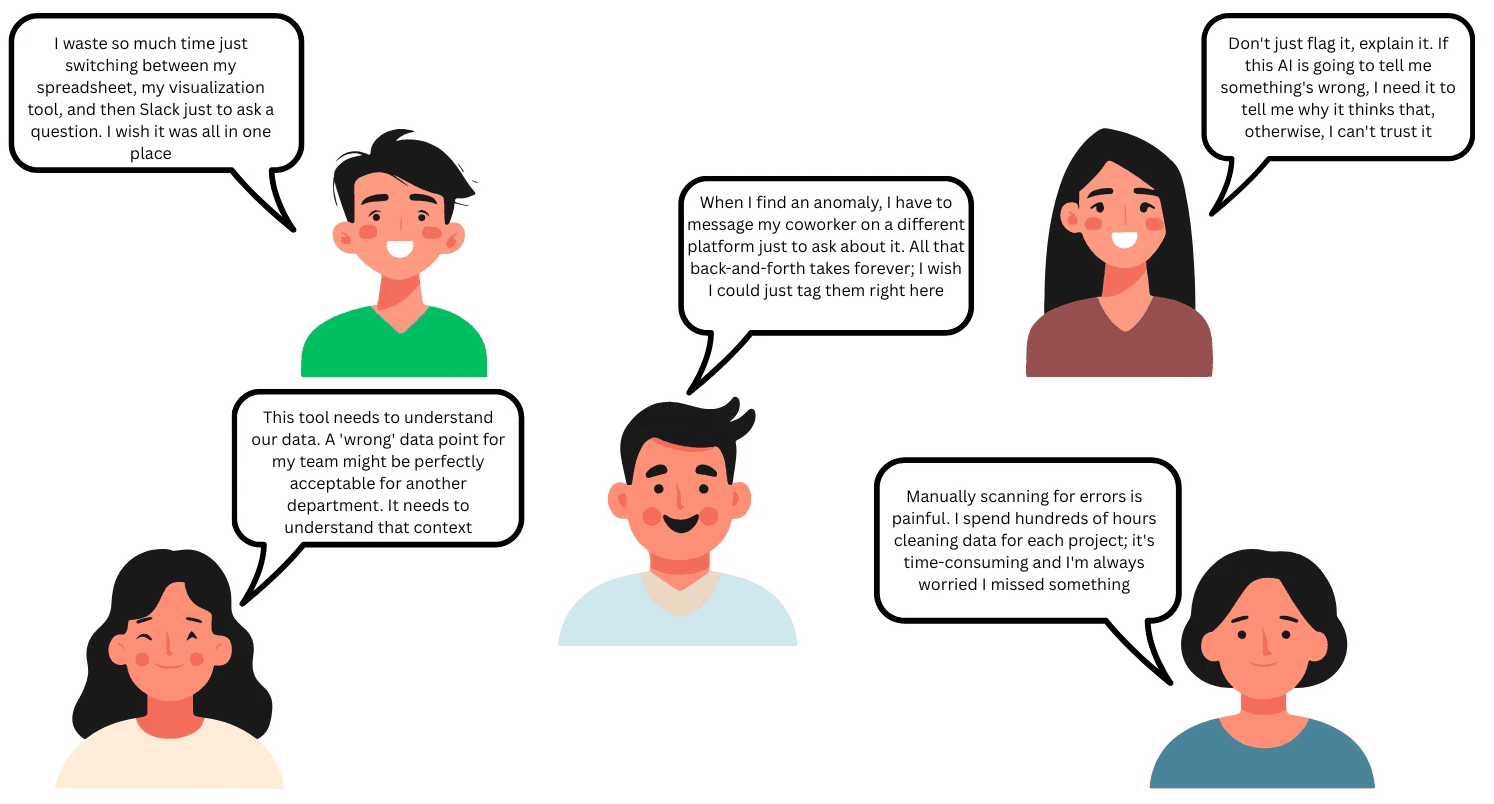
Our user interviews and subsequent affinity mapping revealed five core themes that defined the needs of our users:
Affinity Mapping
Process ⚙️
Our design process was a direct translation of our research findings into a focused, user-centered solution.
Qualitative Research
We conducted pre-interview surveys and held in-depth interviews with four professionals, asking around 10 open-ended questions to understand their thoughts and feelings about the current process of finding anomalies.
↓
Synthesis and Persona Development
We synthesized our findings using an affinity diagram. This led to the creation of three distinct user personas—Sarah (the expert), Paul (the intermediate user), and Richard (the non-technical user)—to represent the diverse needs of our audience. We chose to focus our design on "Paul," the accountant who is proficient with spreadsheets but feels uncomfortable asking for help and gets overwhelmed by complex tools.
↓
Journey Mapping
We created a user journey map to visualize Paul's current process, highlighting his feelings of being overwhelmed, frustrated, and uncertain at various stages of finding an anomaly. This helped us pinpoint the exact moments where our tool could provide the most value.
↓
Design and Prototyping
The Inspiration: "Grammarly for Data"
When designing for our primary persona, "Paul"—an accountant who often feels overwhelmed by complex tools—we knew we needed an interface that felt supportive rather than technical. We looked to Grammarly as our primary mental model.
Just as Grammarly demystifies complex syntax for writers without taking over the document, we wanted our AI assistant to demystify data errors for analysts without obscuring the spreadsheet. We adopted its "suggestion-based" pattern, where errors are flagged in a non-intrusive side panel, offering plain-language explanations that educate the user rather than just correcting them.
The Prototype: Building the "Intelligent Teammate"
To validate this interaction model, we moved quickly into Figma to build a high-fidelity, interactive prototype.
Contextual Side Panel: We designed the AI assistant to live in a collapsible side drawer. This ensured users could view the "detected anomalies" and the "raw data" simultaneously, solving the issue of fragmented workflows.
Interactive States: We prototyped key micro-interactions, such as the "One-Click Scan" and the "Resolve" flows, to demonstrate how the tool transforms a 100-hour manual task into a seamless point-and-click experience.
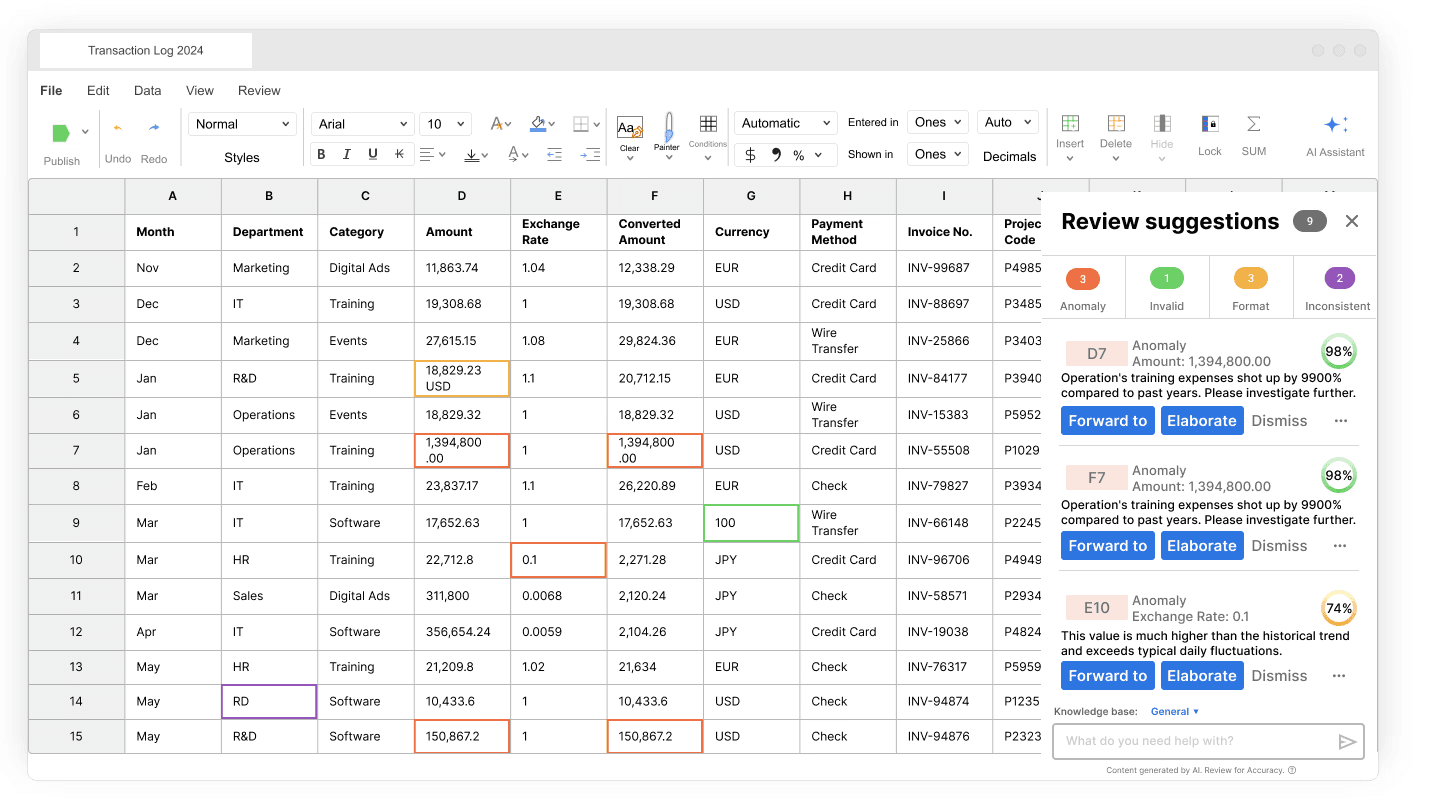
Final Design 🎨 & Rationale 🤔
The final design is an AI-powered assistant embedded in a side panel within the Workiva spreadsheet. Each feature is intentionally designed to address a key user need discovered during our research.
One-Click Anomaly Scan
A single-click scan automates the 'painful' manual process, instantly identifying and categorizing errors to save significant time
Clear, Actionable Explanations
By offering clear, plain-language reasons for every flag, the tool ensures users understand why an error occurred, satisfying the critical need for transparency over simple identification
Integrated Collaboration
By allowing users to send messages to coworkers and providing context (screenshots, the report itself) directly within the panel, we solved the problem of app-switching, ensuring all communication remains contextually tied to the data
While this was a 2-week hackathon project, the projected impact based on user validation suggests:
☕
Increased Productivity
By automating the manual detection process, the tool is expected to significantly reduce the hundreds of hours professionals spend on data cleaning, freeing them up for higher-value analysis.
📊
Improved Data Accuracy and Reduced Risk
By systematically catching errors that a human might miss, the assistant would improve the integrity of financial reports and business data, reducing the risk of costly mistakes.
💯
Enhanced User Confidence and Satisfaction
The user journey map identified feelings of frustration, uncertainty, and stress. By providing clear explanations and collaborative tools, the assistant is designed to transform this into an experience of confidence and relief.
⬆️
Increased Platform Adoption
An intuitive, powerful feature that solves a major user pain point can serve as a key differentiator, encouraging deeper adoption of the Workiva platform.
☕
Increased Productivity
By automating the manual detection process, the tool is expected to significantly reduce the hundreds of hours professionals spend on data cleaning, freeing them up for higher-value analysis.
📊
Improved Data Accuracy and Reduced Risk
By systematically catching errors that a human might miss, the assistant would improve the integrity of financial reports and business data, reducing the risk of costly mistakes.
💯
Enhanced User Confidence and Satisfaction
The user journey map identified feelings of frustration, uncertainty, and stress. By providing clear explanations and collaborative tools, the assistant is designed to transform this into an experience of confidence and relief.
⬆️
An intuitive, powerful feature that solves a major user pain point can serve as a key differentiator, encouraging deeper adoption of the Workiva platform.
Increased Platform Adoption
What I learned 💭
Automation Requires Human Context 🤖
The most critical lesson was that automation alone is not enough. While our initial assumption was to simply find errors faster, our research revealed that the human elements of understanding, trust, and collaboration were equally important. Without the user interviews, we would have missed the crucial need for explanations and integrated communication.
The Power of Personas 🙋🏻♀️
Focusing on the "Paul" persona was a key strategic decision. It forced us to design for someone who needs support and clarity, not just another complex tool for power users. This ensured the final design was accessible, intuitive, and genuinely helpful.
Next Steps 🪜
The clear next step would be to conduct a quantitative usability study to validate our design. We would measure task completion time, error rates, and user satisfaction scores to gather hard data on the tool's effectiveness before moving into development.